Windchill Business Analytics: Programming Journal
Part 02: Getting Data with SQL Queries
Last Updated: August 14, 2016
The first portion I want to begin with is SQL. I need to see what kind of data I can get from the current database and work on getting it in an easy to read form. From the very top image which shows the first Google Chart instance, you can see that I am displaying the Total Number of Files Checked In during the entire history of the system based on month for the three major objects types. After some trial and error my SQL query gave me the exact table of data I needed. I have listed a summarized version below as I'm sure you can see you just need to repeat for each month.
Notice the new_time portion of the query. After initially poking around, I saw that all the dates in the database were based on the GMT time zone. I switched the time zone to my local time zone in order to get more accurate results. Although it doesn't matter so much for the results based on months, it would definitely matter if you are doing queries based on days and were a 24/7 shop. The wrong time zone would alter your results.
Once you expand the query to include all months and the extra WTPart object type, you get this as the final result:
Once you expand the query to include all months and the extra WTPart object type, you get this as the final result:
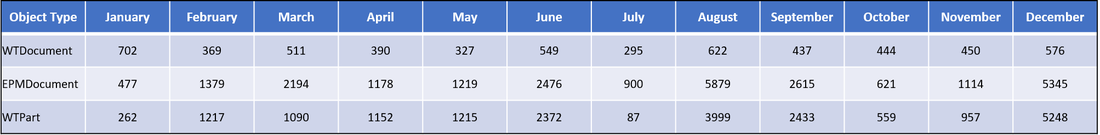
SQL Query Result for Total Checked In Files by Month
Perfect! I have learned that you should always try to do what you can via a single query first and in this case I got exactly what I wanted.