Windchill Business Analytics: Programming Journal
Part 06: Displaying XML in HTML
Last Updated: August 17, 2016
Now is probably the most important part. I need to display the XML data to the user. For this, I chose to use Google Charts because they have an extension library of chart types and some decent examples on their page. Getting the data to display will involve a mix of JavaScript and HTML.
I often feel it is best to learn by example so I will just get to the code. Please see comments for hints as to what each piece does.
I often feel it is best to learn by example so I will just get to the code. Please see comments for hints as to what each piece does.
The above code could probably be simplified further but I will leave that for another time. Opening the html file in a web browser gives:
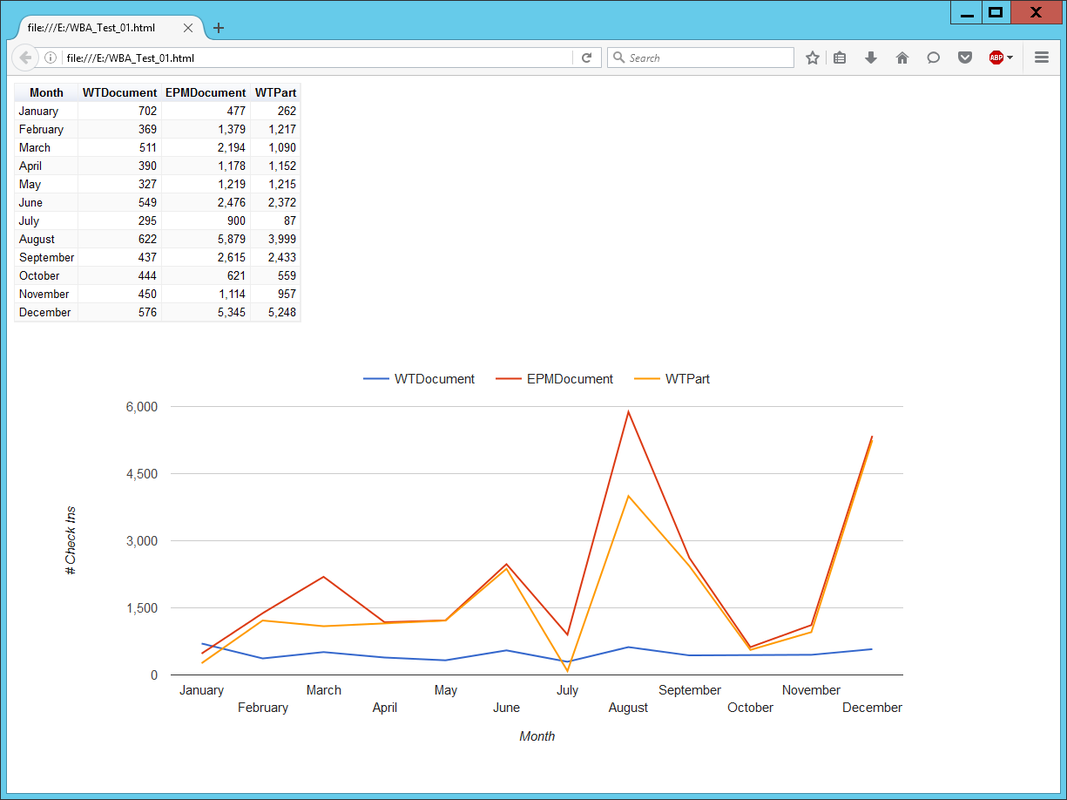
W.B.A. XML to HTML with Google Charts Test 01
Very cool! It is always exciting to see your work extend beyond code. Now I know this looks a little bit different from the introduction page image but we will get to styling in a future section. I wanted to show what is close to bare minimum to get the data to display. Feel free to copy the html and mess around with the styling yourself. Tinkering is the best way to understand code and anything really. I have copied the XML I used in this example below so you have a functional place to start.